 Service blueprint — five-phase journey mapping
Dit project is beveiligd. Voer de toegangscode in om de case study te bekijken.
Onjuiste code. Probeer het opnieuw.
← Terug naar overzicht"I created an Map for Erfgoed Gelderland to understand where smart-glasses technology could add value within the museum visit."
Erfgoed Gelderland supports over 250 heritage institutions. Many museums want to inform, surprise, and educate visitors, yet visitors still face unclear information, confusing navigation, and technology that doesn't always align with their expectations.
My project examines whether smart glasses can strengthen the museum experience — and if so, at which touchpoints they can play a meaningful role.
I needed a structured, shared model of the entire journey to identify where smart-glasses features could be relevant.
The map would expose friction points and emotional dips, help understand visitor goals and expectations, align different stakeholders around the same narrative, and identify high-value moments where smart glasses could support orientation, interpretation, or engagement.
To build the map, I used multiple research methods — each chosen to capture a different layer of the visitor experience.
Field observations in several museums to capture real visitor behaviour. I watched, noted, and documented what people actually did — not what they said they did.
Empathy mapping from the perspective of a visitor: what I saw, heard, thought, and did. Combined with online research on museum websites, ticket flows, and pre-visit information.
Journey walkthroughs as a visitor myself to document confusion, expectations, and emotions at every stage of the visit.
A service blueprint session with museum staff to understand backstage processes that shape the visitor experience. All insights were sorted using the core building blocks of Mapping: doing, thinking, and feeling.
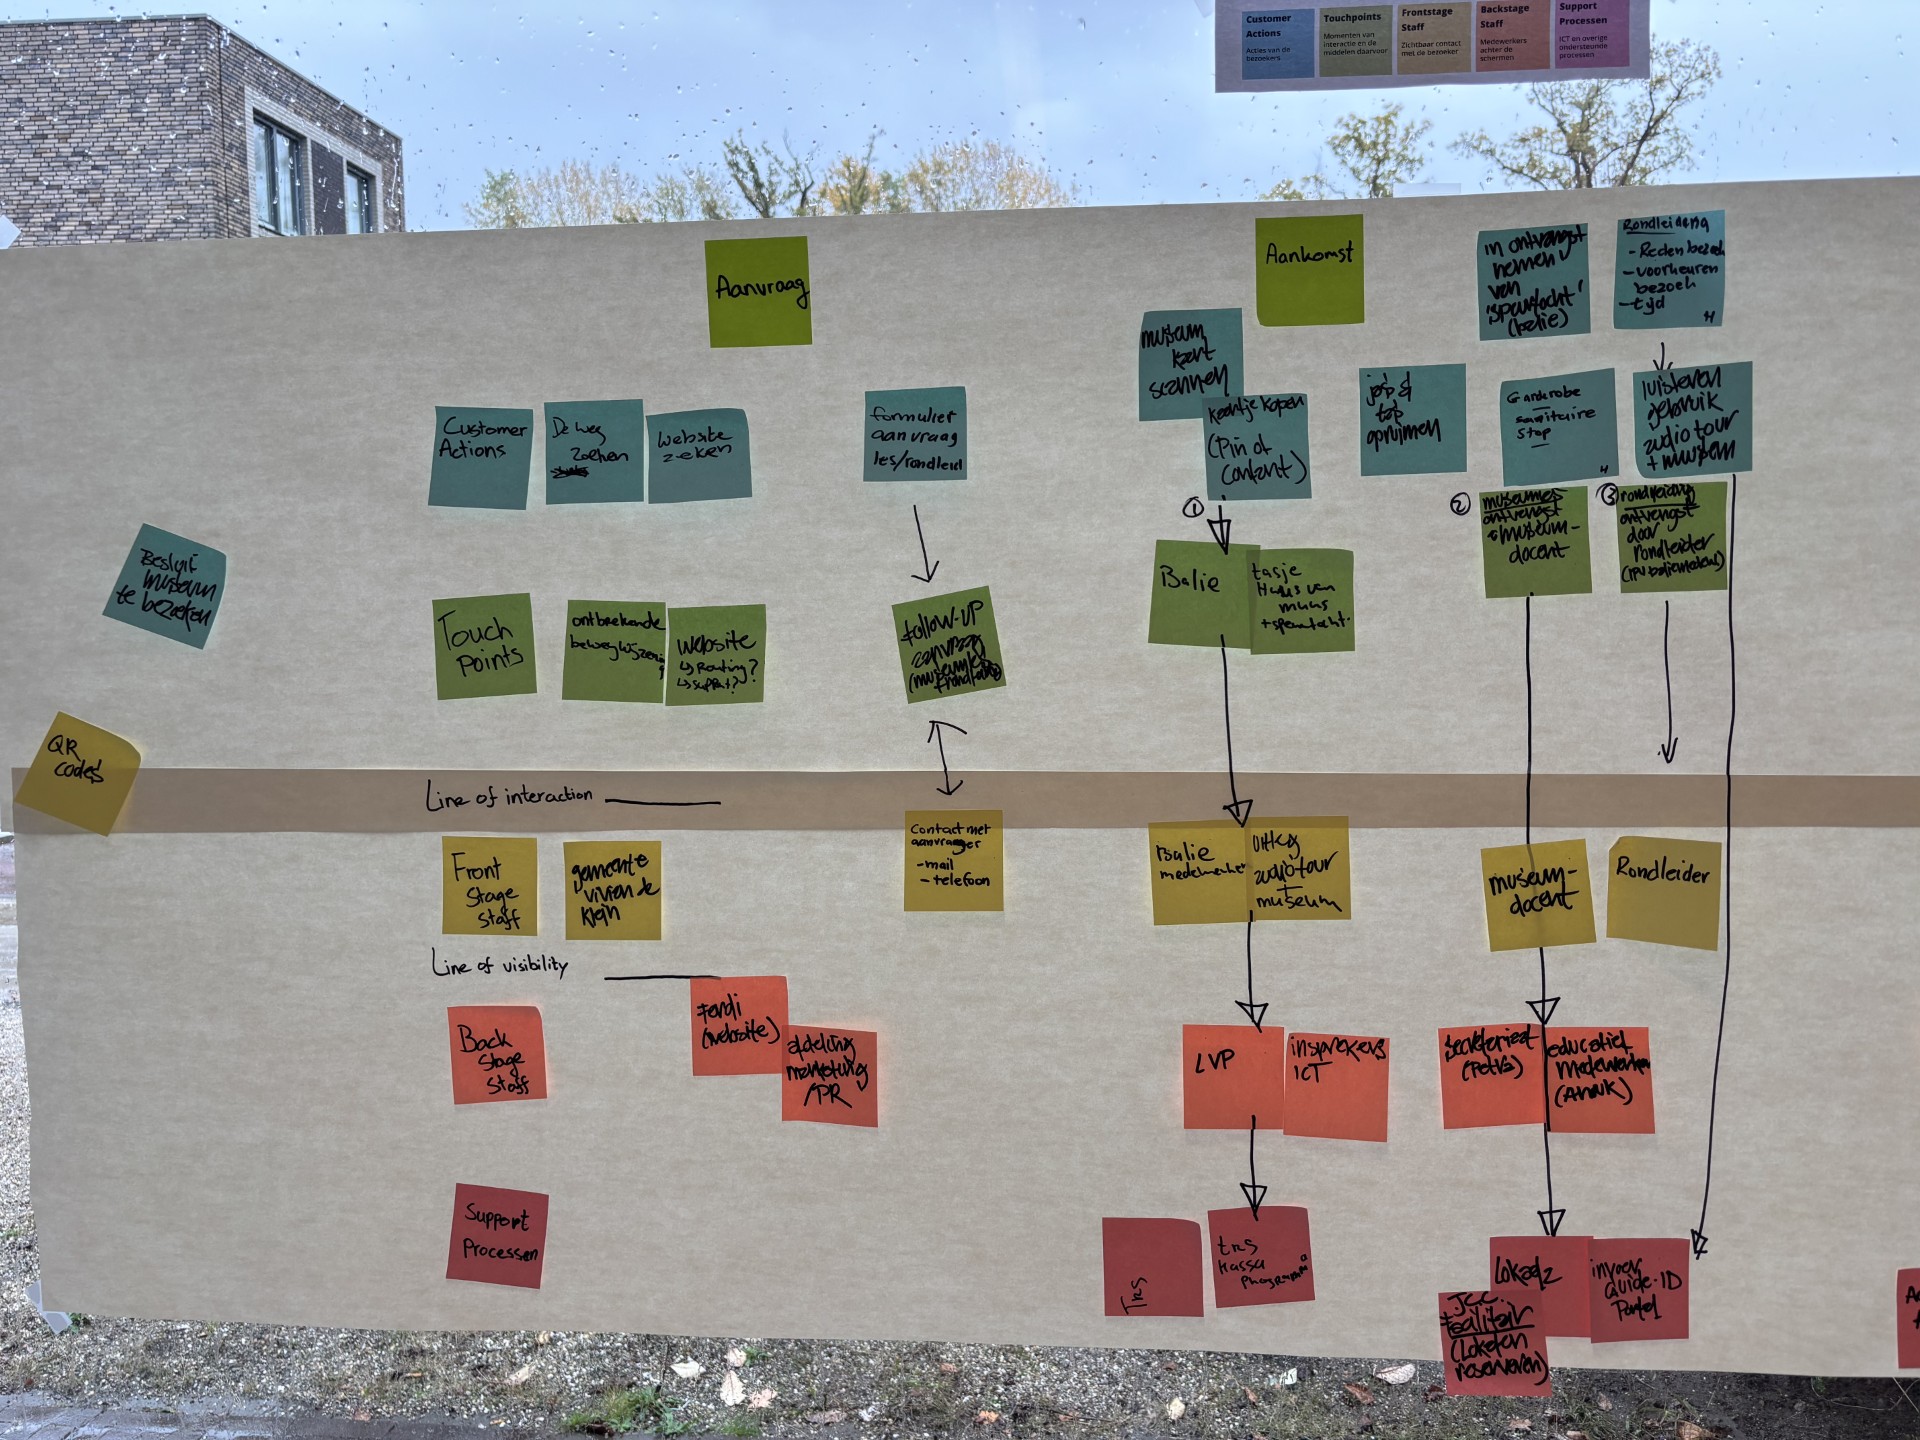
Service blueprint — five-phase journey mapping
The final map visualises the complete journey across orientation, travel, arrival, museum exploration, and the exit phase.
It reveals moments of uncertainty before arrival, navigation issues around the entrance and within the building, breakdowns between physical objects, audio, and interactive media, and emotional highs during discovery and lows caused by unclear information or malfunctioning tech.
The map highlights specific opportunity zones — such as personalised, immersive museum experiences and smart, dynamic on-site guidance.
The Map documents the full five-phase journey: touchpoints, backstage actions, and the emotional arc across the entire visit.
Visitor confusion often starts long before the museum doors. Pre-visit information, ticket flows, and travel logistics all shape expectations.
Emotional dips usually relate to unclear instructions, technology, or navigation — not the heritage content itself.
Smart glasses can only succeed if they integrate seamlessly into critical moments. A shared map accelerates alignment and helps organisations move from assumptions to evidence-based decisions.